· rreck · 20 min read
Congress: Company Filings, Votes, and Trades
Three public corpora joined end to end: every SEC filing since 1994 (27 million), the complete roll-call record of Congress since 1789 (113,512 roll calls, 26.4 million individual member votes), and the stock trades members disclose under the STOCK Act (66,760 transactions). Five plausible hypotheses were tested on the 119th Congress against null models and base rates. All five failed. The four findings that survived are structural, not scandalous, and the most useful result in the whole exercise is a negative one.
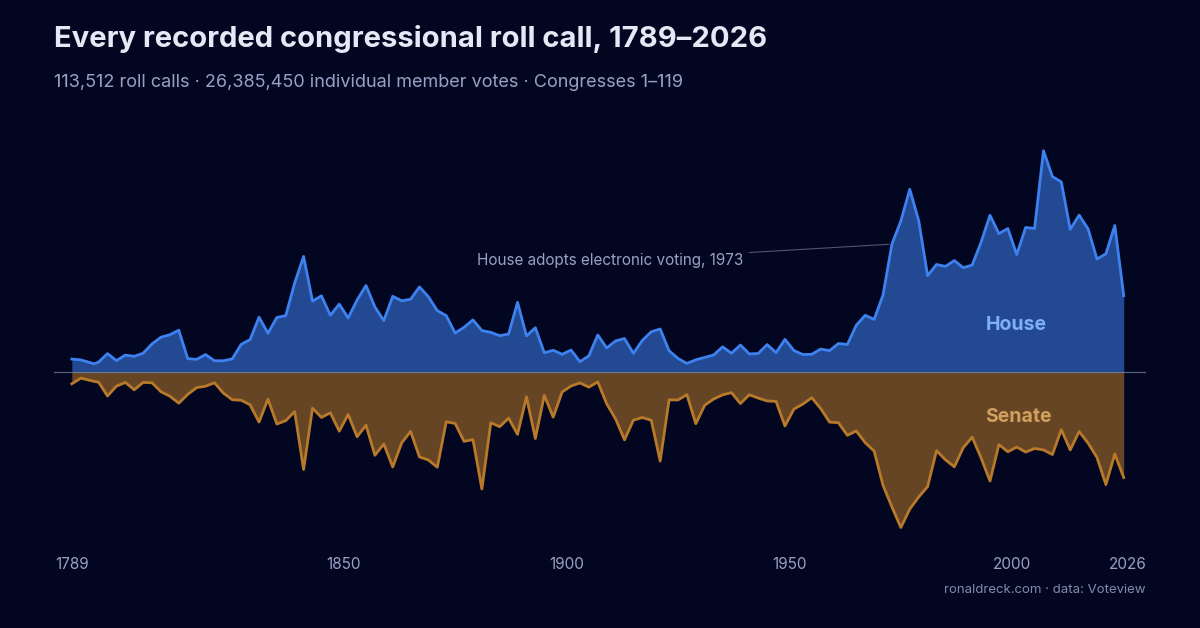
Updated 11 August 2026: the vote corpus behind this system now spans every recorded roll call since 1789. The hypothesis tests were run on the 119th Congress and are reported unchanged; the update at the end details the historical extension.
Abstract
This is an account of building a measurement system across three public corpora and then failing to find what it was built to find. The question is whether legislation, financial disclosure, and votes say anything about each other once you can read all three at once. The corpora are the SEC EDGAR archive (876,725 registrants, 27,039,431 filings), the complete roll-call record of Congress since 1789 (113,512 roll calls, 26,385,450 individual member votes), and financial disclosures filed under the STOCK Act (19,431 filings, 66,760 transactions). Each was loaded completely rather than sampled, and each analytic was tested against a base rate or a permutation null before being believed.
Five hypotheses were tested, each on the 119th Congress — the slice of the vote record that overlaps the disclosure corpus (1,513 roll calls, 365,630 member votes). All five failed. Campaign funding does not explain voting deviation. Stock-trading activity is uncorrelated with ideology. What members say does not predict how they vote better than their party label does. Committee jurisdiction barely predicts what members hold. And dropped risk factors — the analytic this system was designed around — turn out to follow corporate distress rather than lead it.
Four findings survived. They are structural facts about how disclosure works, not revelations about anyone’s conduct, and the most valuable of them is that twenty members of Congress file disclosures from which no machine can extract a single transaction.
The corpora
Everything here comes from public sources: EDGAR bulk data, House Clerk EVS roll-call XML, Senate LIS vote XML, the Voteview bulk vote files for the historical record back to 1789, the House Clerk financial disclosure index, the Senate Electronic Financial Disclosure system, FEC bulk data, and the public-domain congress-legislators roster with every person who has ever served. No paid feed, no proprietary rating, nothing hand-scored.
Two things about the EDGAR corpus are worth stating because they invalidate the obvious approach.
First, the extracted file set is a 16% subset. A directory of 143,165 CIK*.json files looks like the whole registrant universe. It is not — submissions.zip holds 881,294 members, and the true count is 876,725 companies and 24.2 million filings in the snapshot. Working from the extracted files understates late-filing notifications by 57% and non-reliance filings by 66%.
Second, filings.recent truncates at about 1,000 entries. The remainder lives in overflow shards named in a filings.files[] array. 3,708 companies are affected, and the shards hide 16.7% of the entire snapshot — 4,033,505 filings. Reading filings.recent alone silently loses them.
A daily-index pass closed a 27-month staleness gap, adding 2,833,951 filings and bringing coverage to the present. Total: 27,039,431 rows, reconciling exactly against the census once 57 intra-CIK duplicate accessions are accounted for.
One schema note, because it is a trap. An accession number is a submission identifier, not a per-company one — joint filings are disseminated under the issuer and every reporting owner. One accession appears 114 times. Using accession as a primary key destroys 8,425,187 rows, 31% of the corpus, and arbitrarily assigns each filing to one co-filer.
The vote record
The congressional side of the database is the complete roll-call record: 113,512 recorded votes — 59,885 in the House (the first on 16 May 1789), 53,627 in the Senate (17 July 1789) — carrying 26,385,450 individual member positions: 14,161,666 on the yea side, 8,692,541 on the nay side (counting paired and announced positions with their side), and 3,531,243 recorded as present or not voting. Coverage was verified per Congress and per chamber: none of the 119 Congresses is missing from any table, every Congress has both chambers, and every one of the 26.4 million votes joins to a roll call. Alongside the votes sit all 12,768 people who have ever served, with party, state, district, and ideology coordinates for each member in each Congress, across 45,533 terms of service.
The record is heavily back-loaded. The House took 28,512 recorded votes in its first 184 years and 31,373 in the 53 years since it adopted electronic voting in 1973 — the regime change is the visible step in the chart at the top of this page. The busiest chamber in any Congress is the House of the 110th (2007–08) at 1,865 roll calls; the Senate’s peak is the 94th (1975–76) at 1,311. The quietest sit at the very beginning — the 2nd and 3rd Congresses recorded 154 and 148 votes across both chambers combined.
The membership half of the record has its own superlatives. John Dingell Jr. appears in 30 Congresses, the 84th through the 113th. The most recorded yea-or-nay positions belong to Christopher Smith at 25,660 — four ahead of Dingell’s 25,656, and still counting, since Smith is a sitting member.
Fifty distinct party labels appear across the record. The Democratic label has been on the floor since the 25th Congress and accounts for 23,695 member-congress records; the Republican label since the 34th, at 20,168. Before and alongside them: Democratic-Republicans (1,976), Whigs (1,190), Jacksonians (986), Federalists (847), and forty-four smaller labels down to single members.
Because every member in every Congress carries NOMINATE coordinates, the distance between the two House party means is computable for the whole two-party era. That distance was around 0.55 through the mid-twentieth century, bottoming at 0.523 in the 80th Congress (1947–48); in the 119th it stands at 0.910, the widest separation of the modern era. The only nominally larger gap in the record is the 34th Congress (1855–57), measured while the Republican Party was months old and tiny — a small-sample artifact of exactly the kind this article keeps warning about.
Two footnotes on drama, since the record supports them: 1,075 roll calls in American history have ended in an exact tie, and another 2,359 were decided by a single vote.
The five hypothesis tests below do not yet use this depth. They are bound to the era where votes overlap the disclosure corpus — the 119th Congress — and are reported exactly as they were run.
The ideology model
Every member of the 119th Congress was placed on a single axis derived only from their own votes. The method is a member-by-vote matrix, lopsided votes dropped, singular value decomposition, first component standardised so conservatives are positive.
The first dimension explains 84.1% of all voting behaviour in the House and 88.0% in the Senate. That single number is what makes a one-dimensional summary defensible at all.
Fitted on the earliest 70% of roll calls and used to predict the last 30% — votes those positions never saw — the model reaches 96.00% in the House and 96.40% in the Senate.
Both numbers are close to meaningless without their baseline. Simply guessing that every member votes with their own party’s majority is right 95.12% and 95.52% of the time. The honest gain is +0.88 points in each chamber, over 68,308 and 12,057 held-out votes respectively.
That the lift reproduces to two decimal places across two chambers of different size, different rules, and different membership, fitted independently, is the strongest evidence that the axis measures something real rather than fitting noise. It is also small. An in-sample fit reports 97.3%; publishing that figure instead would inflate the apparent gain by half.
Finding one: defection counts
Rank members by how often they vote against their own party and the list looks like one phenomenon. It is two, running in opposite directions.
In the House, Republican defectors sit at or beyond their caucus mean of +0.98 — Biggs at +1.00, Roy at +1.00, Crane at +1.04, Perry at +1.02. They are not breaking toward the middle. They are breaking rightward, against their own leadership. Democratic defectors sit toward the centre against a caucus mean of −1.01 — Cuellar at −0.50, Golden at −0.55, Suozzi at −0.72. Genuine moderates, mostly in swing seats.
The Senate inverts the Republican pattern entirely: Murkowski at +0.57 and Collins at +0.69 sit far to the left of a +0.94 caucus mean. Classic centrists.
A party-unity score cannot tell these apart. Any watchdog metric built on defection counts alone treats a Blue Dog and a Freedom Caucus holdout as the same thing.
The party-label bug
The first version of this measurement grouped members by their party label. Three members’ labels do not match the caucus they sit with: Sanders and King are Independents who caucus with Democrats, and one House member switched to Independent mid-session while continuing to caucus with Republicans.
The consequence is that the Senate “Independent” group contains exactly two people. “Voted against your party’s majority” for Sanders meant “voted differently from Angus King,” with ties breaking arbitrarily. In the House, the Independent group contains one person, average group size exactly 1.0 per roll call — that member is mathematically incapable of defecting.
Measured by label, Sanders ranked among the top Senate defectors. Measured by caucus, he ranks 31st at 4.2%, and Fetterman leads at 19.5%. The corrected grouping eliminates the degenerate groups entirely: 47 Democrats and 53 Republicans, no third group.
Party, it turns out, is time-varying, and a roster stores only a point-in-time snapshot. The roll-call record itself is the finer-grained source — it labels that member Republican for all 362 votes in 2025, then Independent for 188 of his 2026 votes.
Finding two: unreadable disclosures
Members must disclose securities transactions over $1,000 within 45 days. All of them comply. But a disclosure filed as a scanned image satisfies the law while defeating anyone who tries to read it at scale.
Of 233 members filing at least three periodic transaction reports, 191 filed every one electronically and 20 filed every one on paper. Across those 20 members’ 460 filings, the number of transactions a machine can extract is zero.
The bimodality is what makes this a choice rather than a technology transition. A migration would leave everyone mixed — paper early, electronic later. Instead two disjoint populations run side by side across 2020–2026, and the aggregate paper share declines only gently, from 18.6% to 10.4%, because the same small group keeps filing the same way.
There is a caution here that cuts against the obvious reading. The heaviest paper filers submit exactly one report per month, every month, for years — an unbroken rhythm rather than the irregular bursts self-directed trading produces. That is the signature of an advisor-managed account where a broker files periodically on the member’s behalf. It suggests less personal control over the trades, not more concealment of them.
What is fair to say is narrower and still worth saying: 213 members can be audited by anyone with a script, and 20 cannot be audited by anyone without manually transcribing 460 scanned documents. Every watchdog dataset silently covers only the readable population.
Finding three: the disclosure window
Every disclosed trade has a gap between when it happened and when the public learned of it. Counting, for each day, the transactions that had occurred but were not yet filed produces a running measure of how much was unknown.
The peak is 3,970 transactions on 4 April 2020, representing $60.4M–$165.7M in disclosed bounds. A typical day sits above 1,100. Median delay from trade to disclosure is 28 days; the 90th percentile is 63 days; the worst single case is 3,698 days, just over ten years. 14.2% of transactions were disclosed after the statutory deadline.
The spring 2020 peak is a mechanical consequence of trading volume, not evidence about conduct — more trades in a short period means more of them simultaneously inside their reporting window. It is still the moment when the gap between what Congress had done and what the public could see was widest.
Finding four: silent restatements
Every XBRL fact published by a company carries the accession number of the filing that reported it. When the same company, concept, and period appears with a different value under a later accession, a previously reported number was revised.
Sweeping all 17,904 companies with XBRL data — 106,009,927 facts, 28,230,833 period groups reported under two or more accessions — yields 1,646,936 material revisions affecting 76.9% of companies, using a threshold of at least 5% change and at least $100,000 in absolute magnitude.
The signal is not the revisions themselves. It is where they surface: 783,628 in an ordinary 10-Q and 605,603 in a 10-K, against only 110,186 arriving via an explicit amendment. That gap is the silent part.
The relationship to formal distress is strong and monotone. Against companies with no material restatement, those with five or more revisions to core concepts show a non-reliance filing rate of 46.71% versus 6.45% — a 7.2× relative risk. Late filings rise from 32.59% to 74.35%.
And the practically useful part: 73% of core-concept restaters never file a non-reliance notice at all. A screen built on those notices misses that population entirely.
A caveat that should not be skipped. Ranking revisions by percentage change produces an artifact list, not a finding — newly IPO’d and spun-off registrants file nominal stub balance sheets that are later replaced by real numbers, so a $1 opening figure becoming $4.997B looks like a 500-million-percent restatement and is simply a scope change. Most of the largest dollar revisions are legitimate spin-off recasts. The algorithm cannot separate a recast from a correction, and does not claim to.
The five failures
Every hypothesis below was plausible, and each was tested with a null model or a base rate before being believed. None survived.
Campaign funding
Using 122 million individual FEC contribution records, the first pass flagged 305 apparent findings against roughly 284 expected by chance. The top hits were single-donor employer strings with coefficients between −47 and +54.
The cause was a filter that tested for finite exposure, and zero exposure is finite — so a single donor became a “sector” with 424 members, 423 of them sitting at exactly zero, and the slope fitted through one leverage point. Regated on strictly positive exposure with a minimum of 20 members and Benjamini-Hochberg correction, only 14 employer strings are testable at all, and the single result surviving correction is the string "retired" — a donor occupation, not an industry.
Raw contributor employer strings are not sectors, and there is no evidence in this data that funding exposure explains deviation from a member’s own fitted position.
Trading and ideology
House members who file transaction reports average 0.987 in distance from the ideological centre; non-filers average 0.999. Within party the gap is smaller still.
The Senate initially appeared to disagree — a pooled difference of −0.047 with a permutation p-value of 0.018. It is entirely a party-composition artifact. Republicans have both a lower mean distance and nearly twice the filing rate; controlling for party the effect vanishes (p = 0.85 and p = 0.25). Reporting the pooled figure alone would have manufactured a House/Senate divergence that does not exist.
The only real difference is participation: 62.3% of Senate Republicans file at least one report versus 37.8% of Democrats, and 33% versus 25% in the House.
Speech and votes
9,215 floor statements across 512 members were embedded and regressed onto the voting-derived ideology scale. Held-out R² is 0.623 — which sounds respectable until you compare it to the trivial baseline of predicting each member’s own party mean, which achieves R² = 0.985 on the same data.
The messaging model is worse than knowing party. Within-party held-out R² is deeply negative. After a 200-permutation null, 2 of 373 members have a gap between stated and revealed position that is statistically distinguishable from zero.
Committees and holdings
Mapping 4-digit SIC ranges to 230 committees and subcommittees, and comparing holdings against base rates among disclosing members, produces lifts clustered between 0.7 and 2.2. Several mapped pairings sit below base rate. The most intuitive pairing of all — Financial Services members holding banking stocks — reaches only 1.24. The highest lifts rest on the smallest cells.
Risk factors
This is the one the system was built for. 14,199 annual reports were fetched for the companies Congress holds, Item 1A extracted at 98.89% usable with hand-validation on 25 filings from 25 random companies at 24/25 correct, and 4,597,264 paragraphs stored.
Risk-factor drift is real and substantial: median self-novelty of 14.7%, only 6.2% of filings at 95% or more carryover, and 317,475 paragraphs dropped (19.9%) across 12,169 consecutive filing pairs.
And the relationship to distress is genuine — monotone across all ten deciles, with the heaviest droppers showing a 12.59% forward distress rate against an 8.12% base rate, a 1.55× elevation.
But checking the other direction dissolves the thesis. The prior twelve-month distress rate for the same cohort is 14.73% against a 9.17% base — 1.61×. Dropped risk factors cluster after distress at least as much as before it. On this evidence it is a concurrent marker, not a leading indicator, and reporting only the forward direction would have inverted the conclusion.
Method notes
Prefer the recorded field over the derived one. The disclosure window was first computed from a derived lag column, giving a peak of 3,374. The recorded filing date gives 3,970 — the derived column was missing on roughly ten thousand transactions recovered from scans. Where both exist they agree exactly, median difference zero days. The derived field was not less accurate; it was less complete.
Amounts are ranges and must stay ranges. Congressional disclosure uses bands — $1,001–$15,000 and so on. Substituting a midpoint invents precision the law does not require anyone to provide. Every figure here carries a lower and an upper bound, and totals sum the bounds separately.
A vision model will fabricate rather than admit it cannot read. Asked to extract transactions from scanned disclosure forms, a vision-language model produced zero out of twelve documents with a consistent amount across four rotations of the identical image at temperature zero. On a form containing no transactions it invented one, reading the blank form’s own printed worked example as a real trade.
The cause is not poor reading. The amount on these forms is a mark in one of ten or eleven unlabelled positional columns, and reading it requires exact column registration that the model does not perform. Doing that registration geometrically — detecting the printed grid, deskewing, and deciding each cell by ink density, with the model never asked for an amount — recovered 25,127 transactions from filings two earlier attempts had written off as unreadable, with 107 of 108 hand-checked values exactly correct and the one miss rejected rather than mis-valued.
The trap inside that fix is worth naming. There are six distinct variants of the form, and while some have eleven amount columns, the majority have ten. Assuming eleven on a ten-column form swallows the date column and shifts every amount by one band — producing output that is plausible, lands on valid bands, and is wrong.
The system
Everything described here runs as a live service rather than a one-off analysis, and the read side is public.
sec.rrecktek.com is the interface: registrants, filings, members with their fitted positions, roll calls, disclosure timing, and sector holdings.
Behind it is a read-only JSON API on the same host. No key, no registration — twelve public endpoints:
| Endpoint | Returns |
|---|---|
/api/stats | corpus-wide counts across every dataset |
/api/companies | registrant search by ticker, SIC, state, exchange |
/api/companies/{cik} | one company: identity, filing timeline, form mix |
/api/filings | filings by company, form, date, 8-K item |
/api/members | every member: fitted position, defection rate, attendance |
/api/members/{key} | one member: vote record, attendance, disclosures |
/api/rollcalls | recorded votes with party breakdown |
/api/rollcalls/{id} | one vote, member by member |
/api/disclosure/transactions | individual disclosed trades |
/api/disclosure/darkwindow | the trade-to-disclosure window, daily |
/api/disclosure/legibility | machine-readable share per member |
/api/sectors | congressional holdings by SIC sector |
Two deliberate constraints. Result sets are capped server-side regardless of what is requested, and the two largest endpoints require at least one filter — an unfiltered scan across 27 million filings is not reachable by design. Monetary amounts always return as amount_lo and amount_hi; no endpoint returns a midpoint, because disclosure law does not produce one.
The gap
The third leg of the question is the weakest. The legislative data is in the database — 1,942 identified congressional bills, 42,842 lobbying disclosure filings, 84,343 bill references extracted from them, 1,009 roll calls resolved to a named bill, and 230 committees and subcommittees with their memberships — and the company-to-bill chain does resolve end to end: a filer’s disclosed lobbying on a named bill, that bill’s recorded vote, and the SEC registrant behind the client name.
None of it is exposed through the API yet. Every figure in the legislative sections above came from direct database queries, not from an endpoint anyone else can call. Until /api/bills and /api/lobbying exist, the public surface covers filings, votes, and disclosure but not the legislation that connects them — which is precisely the join that would make the other three worth querying together.
The figures in this article were taken from that API and the database behind it, not from a separate offline copy. Where a number here disagrees with the live endpoint, the endpoint is current and this article is a snapshot dated at the top.
Conclusions
The system works. The corpora are complete, the extraction is validated, and the ideology model beats its baseline by a small, reproducible, honest margin.
What it did not find is a story about individuals. Five separate attempts to connect money, speech, committee position, or corporate disclosure to political behaviour came back weak or null once base rates and permutation tests were applied. Given how many of those tests initially appeared to succeed — 305 funding findings, an R² of 0.623, a significant Senate effect, a 1.55× distress lift — that consistency is itself the result.
The findings that held are all structural. Party explains nearly everything about voting, and the residual is small and hard to beat. Defection counts measure two opposite things at once. Twenty members file disclosures nobody can read. Companies quietly revise reported numbers far more often than they formally announce it.
None of that is a scandal. All of it is measurable, and most of it was not being measured.
Every figure in this article comes from public data. It measures disclosure and voting behaviour, and makes no claim about any individual’s motives.
Update, 11 August 2026
When this article was first published, the database held one Congress of votes — the 119th, the era that overlaps the disclosure corpus. On 11 August 2026 the vote record was extended to the whole history: every recorded roll call of every Congress since 1789, every member who ever served, and per-Congress attributes for each of them. The figures and the section describing that record — The vote record — were added in this update; the title was also changed from the original (“What the Filings Do Not Say”) to something more descriptive, with the URL unchanged.
The vote record comes from the Voteview project’s bulk files, the only complete public corpus of roll calls back to the 1st Congress; the member roster and term attributes come from the public-domain congress-legislators dataset. Both are free, both are redistributable, and both loaded completely rather than sampled — the same rule the rest of this system follows. The new roster links to the existing member crosswalk at 100% — all 12,768 people resolve — so the historical record joins the disclosure and filing corpora through the same keys the 119th-Congress analyses used.
Two honesty notes, in the spirit of the rest of this article. First, the five hypotheses have not been re-run against the historical record; those numbers remain a snapshot of the 119th Congress, and cross-era replication is now possible but not yet done. Second, the historical corpus is not yet exposed through the public API — like the legislative data described in the gap section, it is in the database and queryable, but /api still serves the modern era only.